Unexpected downtime
A local equipment issue can put production, delivery commitments and revenue at risk.
 A project of Concept Loop.
INDUSTRIAL INTELLIGENCE. BUSINESS IMPACT.
Turn machine signals, operational data and enterprise systems into decisions that move your business forward.
Physical signals. Enterprise context.
From machine condition to financial impact.
Evidence-led decisions. Your team in control.
BUILT WITH PHYSICAL-WORLD PERSPECTIVE
LENVOR is a project of Concept Loop, bringing an operational perspective to the connection between industry, resources and business decisions.
Meet Concept Loop ↗Concept Loop’s prior operational work is distinct from LENVOR deployments. Explore the company story ↗
THE CHALLENGE
Disconnected systems turn everyday industrial decisions into a search for context.
A local equipment issue can put production, delivery commitments and revenue at risk.
Consumption figures alone do not explain where efficiency is drifting or why.
Operations, maintenance and finance often see different pieces of the same event.
BEYOND IIoT
LENVOR’s proposed intelligence layer connects the machine event to the business that depends on it.
A threshold was crossed.
What does it mean for this operation?Asset M-104 is abnormal.
Which production orders are exposed?An alert is generated.
Who should act, when and why?Energy use increased.
What is the cost and carbon consequence?THE LENVOR PLATFORM
Your ERP knows the transaction. Your meters know the consumption. Your machines know the condition. LENVOR connects the context, so leadership can understand what matters and decide what happens next.
YOUR OPERATION, IN CONTEXT
Rising vibration, production dependency and cost exposure align.
HOW LENVOR WORKS
Connected context at every step.
Human judgment at the point of action.
PHYSICAL-TO-FINANCIAL INTELLIGENCE
Vibration rises
Condition gains context
Orders and downtime
Cost, revenue and carbon
One signal. A connected business. A clearer decision.
FIVE LENSES. ONE OPERATION.
01 / ASSET INTELLIGENCE
Connect equipment signals with maintenance history and production dependencies to make asset health relevant to business priorities.

MACHINE INTELLIGENCE
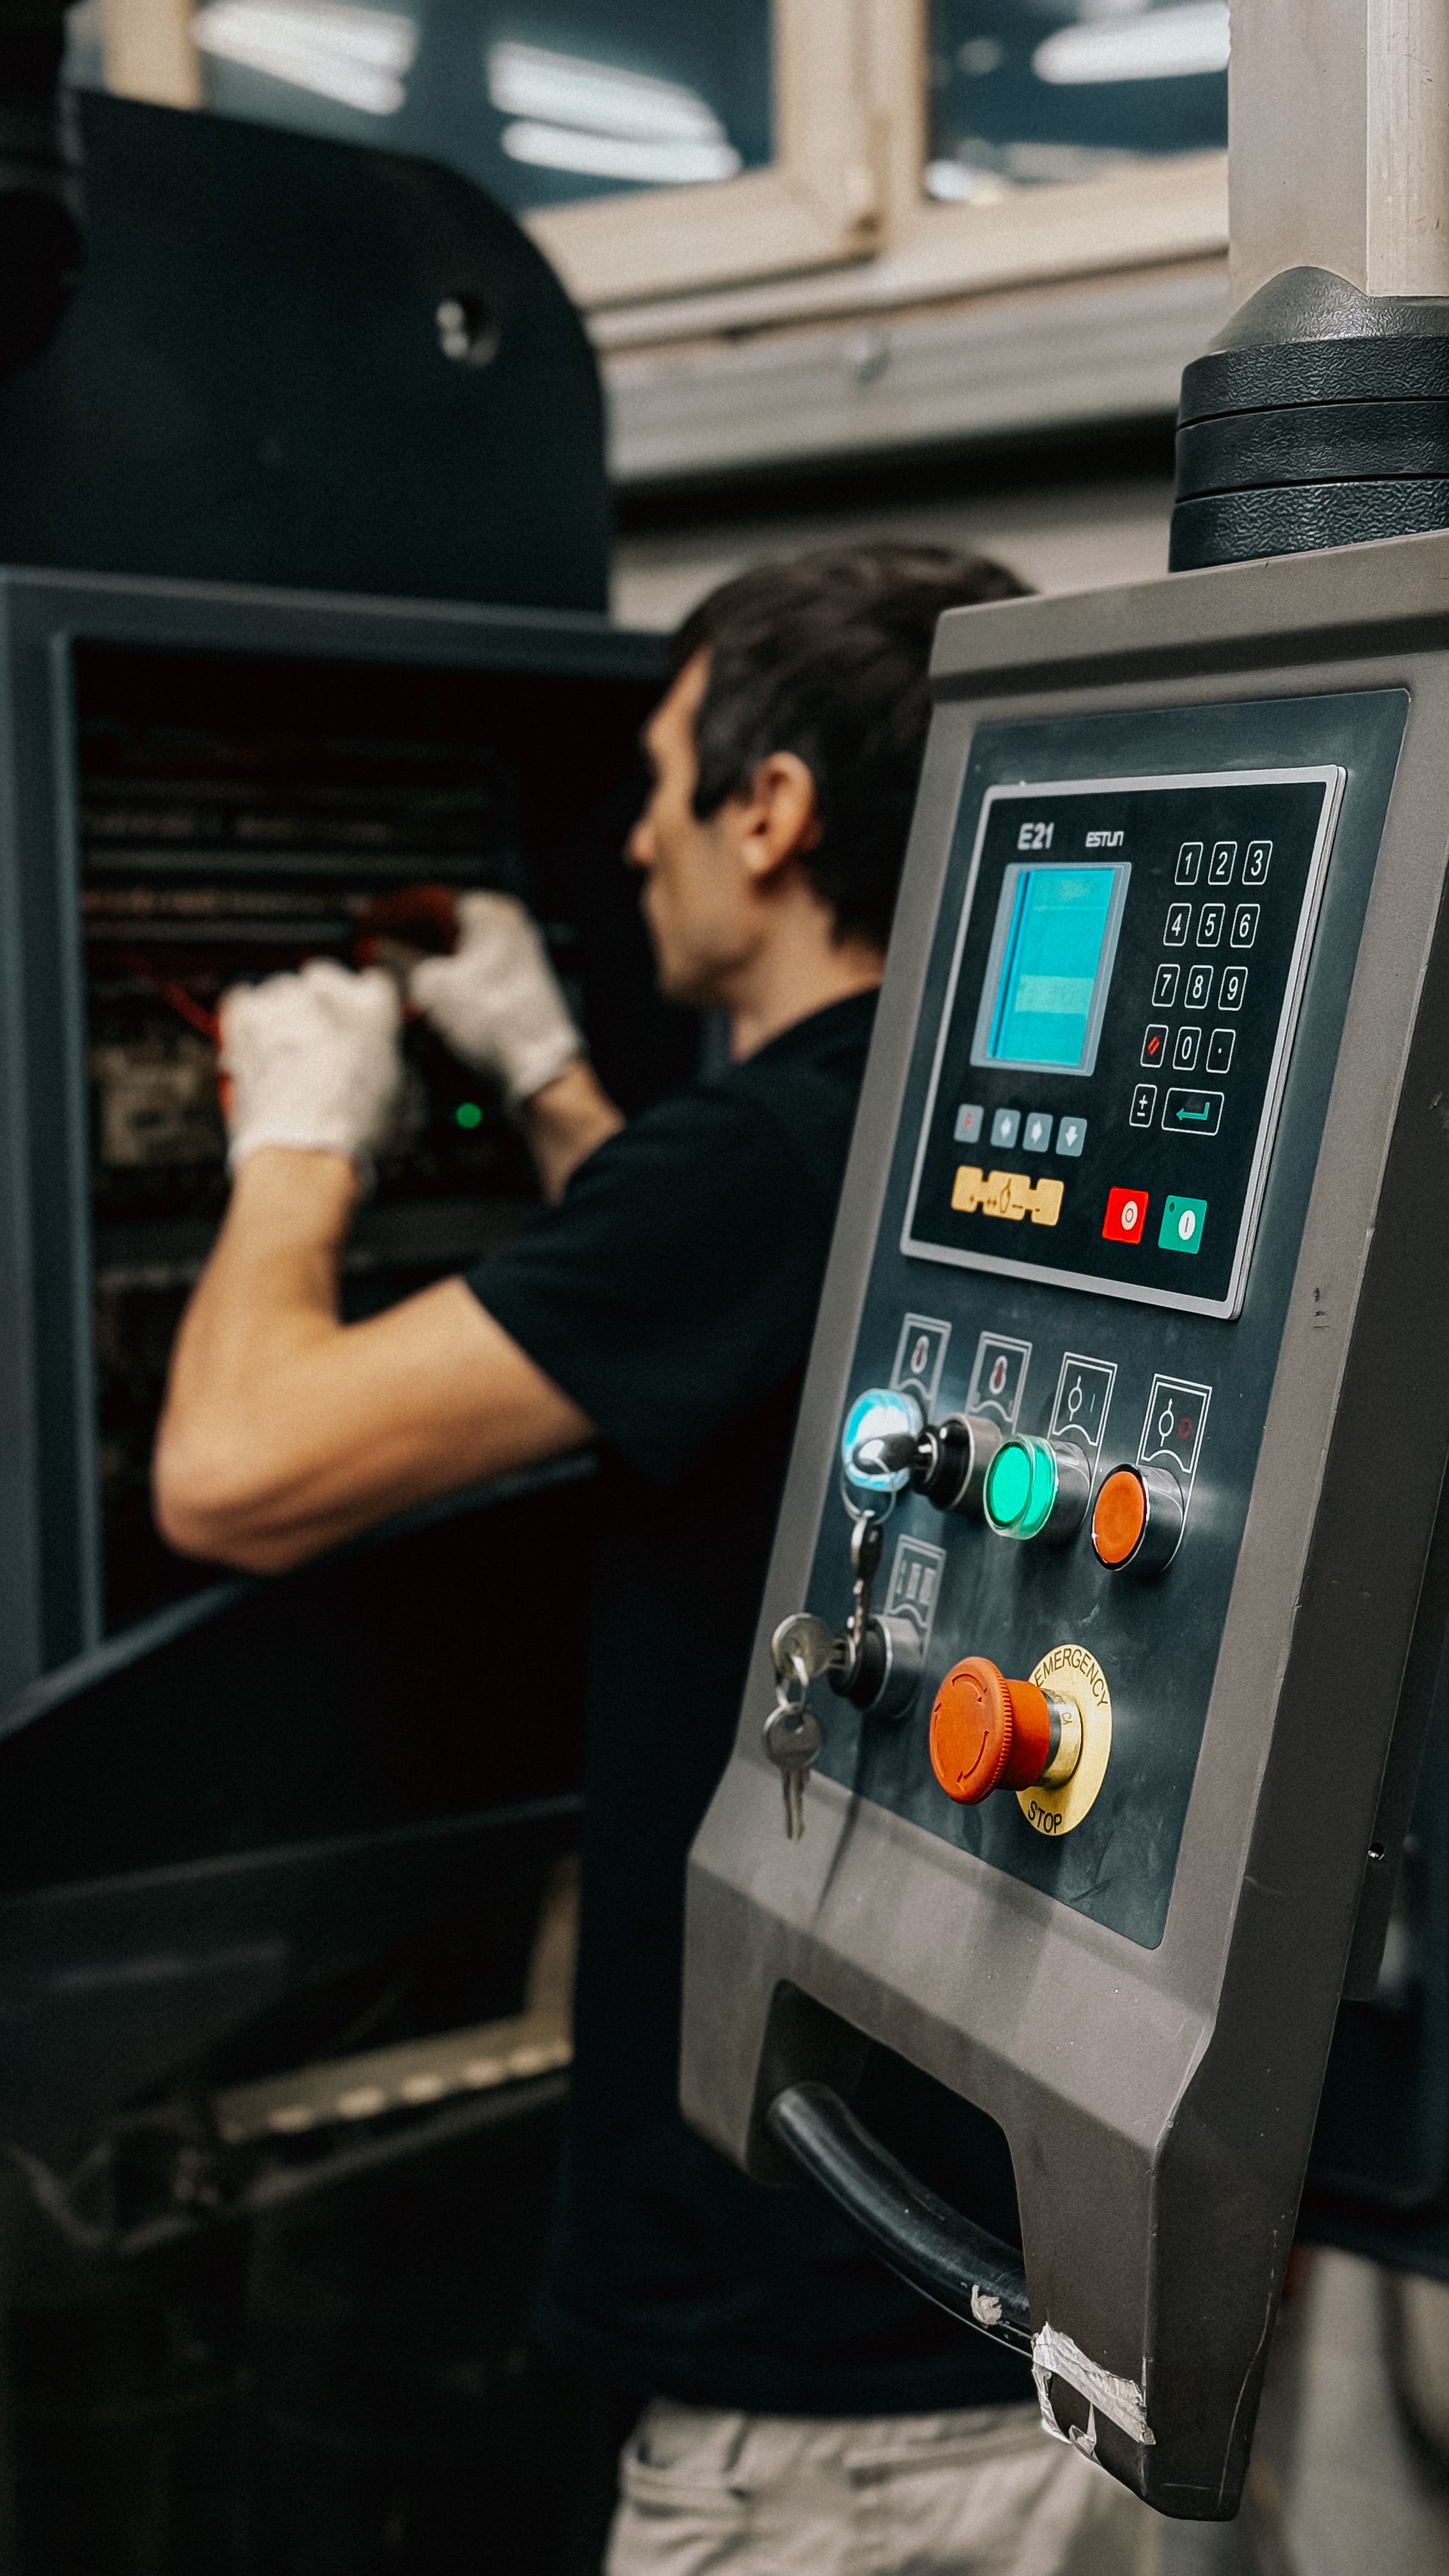
Connect condition signals with the process they support. Investigate what changed, understand what depends on it and give the right team a clear next step.
INTELLIGENCE THAT REACHES THE RIGHT PEOPLE
Put the issue, its consequences and the proposed response in the same view. Leadership sees the priority. The responsible team keeps control of the action.
THE DECISION ENGINE
Prioritize by consequence, urgency and evidence. Every recommendation remains subject to your team’s approval.
Illustrative scenarios, not live predictions. Priorities depend on validated thresholds, data quality and operating context.
BUILT AROUND THE DECISIONS THAT MATTER
INDUSTRY CONTEXT MATTERS
Example application areas. Each engagement starts with your process, systems and operating priorities.
Connect milling, pumps, boilers and energy use with throughput, stoppages and the economics of the crushing season.
CONNECT WHAT YOU ALREADY HAVE
Start with the systems that hold your highest-value signals. Integration scope, protocols and access are confirmed during discovery.
Permissions → Evidence → Recommendation → Human approval
MEASURE WHAT CHANGES
Agree the measures first. Track operational change against evidence. Report results only when validated.
Unplanned stoppages and response time.
Energy intensity at comparable production.
Maintenance, energy and production economics.
Activity data, documented factors and boundaries.
These are proposed measurement categories, not claimed LENVOR customer outcomes.
ENTER THE CONNECTED OPERATION
Invitation-led FDE experience · Interactive demonstration
START WITH YOUR OPERATION
Find the first high-value opportunity across your systems, machines, workflows and resource data.
IMPACT / CASE STUDIES
The first four stories are illustrative case studies. The sustainability story describes the team’s prior operational work. These are not Industrial Leadership OS customer results.
CASE STUDY 01 , AUTOMATION
Illustrative Case StudyIndustry Multi-entity services company
The finance team spent hours every week collecting invoices, checking documents, updating spreadsheets, following up with departments and preparing management reports. Information arrived through email, WhatsApp, shared folders and accounting systems. The process depended heavily on people remembering what needed to happen next.
An AI-driven finance workflow connecting incoming documents, approval rules and internal reporting. The system: captured invoices automatically; extracted key information; checked required documentation; routed approvals; flagged exceptions; followed up on missing information; updated the finance workflow; prepared management summaries. Humans remained responsible for final exceptions and sensitive approvals.
Email · Accounting · Documents · Approvals · Reporting
Before: People moved information between systems.
After: Information moved itself.
CASE STUDY 02 , AI AUTOMATION
Illustrative Case StudyIndustry B2B services company
New leads were arriving through the website, email, referrals and WhatsApp. Response times depended on staff availability. Some leads were followed up immediately. Others disappeared inside inboxes and spreadsheets. Sales teams also spent significant time qualifying inquiries and updating the CRM manually.
An AI sales agent connected to the company’s lead channels and CRM. The agent could: respond to incoming inquiries; understand customer requirements; ask qualification questions; classify opportunities; create CRM records; route high-value leads; schedule follow-ups; remind sales representatives; generate conversation summaries; reactivate inactive opportunities.
Website · Email · WhatsApp · CRM · Calendar
Before: Salespeople managed the process.
After: Salespeople managed the opportunity.
CASE STUDY 03 , MANUFACTURING INTELLIGENCE
Illustrative Case StudyIndustry Industrial manufacturing
The factory already collected production and equipment data. But machine information, maintenance records and production schedules existed separately. Teams could see individual machine events but struggled to understand how those events affected overall production. Problems were often investigated after downtime had already occurred.
A manufacturing intelligence layer connecting: machine signals; production records; shift data; maintenance history; downtime events; operational thresholds. The system continuously analysed machine behaviour and identified abnormal patterns. When something required attention, the relevant team received the event together with operational context rather than another isolated alarm.
Machines · IoT · Maintenance · Production · Alerts
Before: A machine generated an alarm.
After: The business understood what that alarm could affect.
CASE STUDY 04 , ENERGY INTELLIGENCE
Illustrative Case StudyIndustry Multi-line manufacturing facility
The company knew its monthly electricity bill. It did not know precisely which machines, operating patterns and production decisions were driving unnecessary consumption. Energy analysis happened after billing. By then, the opportunity to intervene had already passed.
An energy intelligence system connecting smart-meter data with machine and production activity. The system continuously compared: energy consumption; production output; machine status; shift patterns; operating schedules; peak-demand periods. AI identified abnormal consumption and highlighted the operational conditions causing it.
Energy Meters · Machines · Production · Operations
Before: The company knew how much energy it used.
After: It knew why it used it.
CASE STUDY 05 , SUSTAINABILITY
The following describes the team's prior operational work, not Industrial Leadership OS customer results.
Industry Circular economy / manufacturing
Sustainability performance involved multiple disconnected data points: material collection; processing; production; resource consumption; waste movement; impact reporting. Without traceable operational data, sustainability reporting remained difficult to verify and difficult to connect with day-to-day decisions.
A connected sustainability intelligence workflow bringing operational and impact data into one system. The model linked material flows with processing and production activity to improve traceability and impact measurement. The system supported: material traceability; resource monitoring; impact calculations; operational reporting; sustainability dashboards; evidence collection; management reporting.
A clearer connection between: Operations → Materials → Resources → Impact allowing sustainability performance to become part of operational decision-making rather than an annual reporting exercise.
Operations · Materials · Production · Energy · Impact Data
All figures are presented with methodology and approval notes; only figures approved for public use are published.
START WITH YOUR OPERATION
Find the first high-value opportunity across your systems, machines, workflows and resource data.